Gambia Flag Home Page
Home Page
Accommodation      Flights Excursions Travel & Tourism
 
 
Economy of Gambia

Agriculture    Business    Economic Sectors     Investment 
 
Overview:
The Gambian economy is a highly open type as measured by export and import ratios to GDP, however, as much as 80 percent of exports consist of re-exports. The main domestically-originating exports are groundnuts and tourism.

The Gambia has recently run substantial trade and current-account deficits financed largely by official grants and loans, and increasingly foreign direct investment inflows.

Foreign direct investment in 2003-2005 averaged more than 10 percent of GDP. The country's economy is mainly reliant mainly agricultural exports as a foreign currency earner.
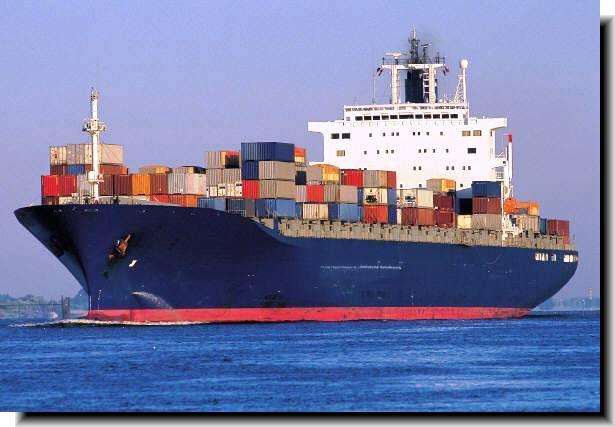
Entrepot (re-export) trade from Banjul Ports makes up a significant portion of economic activity though the devaluation of the CFA Franc in 1994 reduced it somewhat.

Tourism, which mostly takes the form of sun seekers, birdwatchers and African-Americans, makes up about about 18% of the Gambia's GDP.

Economic development is very reliant on continued multilateral and bilateral aid and on prudent economic management by the government as espoused by the International Monetary Fund's fiscal help and advice.

The Gambia is among the poorest countries of the world, ranking 155th out of 177 countries in the 2007/2008 UNDP Human Development Index rankings (HDI). According to the UNDP's Human Poverty Index (HPI-1) of 2004 poverty is was at 40.9 percent, with rural poverty slightly exceeding urban poverty rates, except in Banjul where the rate is much lower. The Gambia’s per capita GDP measured at PPP is higher than Benin, Senegal or Togo, but literacy is low by regional standards.

Services account for over 50 percent of GDP, reflecting the importance of re-export trade and tourism. Agriculture accounts for about a third of GDP but more than 70 percent of employment. The manufacturing sector is undeveloped even by West African standards, providing only 5 percent of GDP and displaying little dynamism.

Macroeconomic performance deteriorated in 2002–03, reflecting the impact of loose fiscal policy, accommodating monetary policy and a drought.

Inflation rose from an average of less than 5 percent in 2001 to 17 percent in 2003, the highest level in nearly two decades. The dalasi depreciated by 55 percent in nominal effective terms between end-2001 and end-2003. The seeds for the poor performance were sown in 2001 when a combination of significant unbudgeted expenditures and a fall in tax revenues led to a large increase in government borrowing from the Central Bank of The Gambia (CBG) and a sharp rise in domestic debt. Real GDP declined by 3 percent in 2002 because of a drought, but recovered in 2003.

The 2002 IMF Poverty Reduction and Growth Facility (PRGF) loan was cut off in 2002 following spending overruns and irregularities at the CBG. The Gambian government has sought to re-establish a program with the Fund through a Staff-Monitored Program (SMP) as an interim step towards re-establishing a PRGF. The IMF notes that fiscal and monetary policies have been tightened lately, contributing the sharp decline in inflation, from double digits in 2003-2004 to 4.5 percent in 2005. Nevertheless, the IMF expresses continued concerns about slippages in fiscal discipline, extra-budgetary expenditures, and inadequate auditing of both fiscal and monetary accounts. The Gambia’s fiscal policy is also constrained by a large domestic debt and high real interest rates, such that a substantial primary surplus is required to cover interest payments.

As at 2008 The Gambia currently had a Staff Monitored Programme with the IMF, as part of a Medium Term Economic Framework Plan. The agency has reported some modest progress on fiscal balance and some improvements in financial management.

A tightening of fiscal and monetary policies from late-2003 restored macroeconomic stability and contributed to sustained growth. The basic primary fiscal balance moved from a deficit of over 1 percent of GDP in 2001 to an average surplus of nearly 9 percent of GDP during 2004–07.  Yields on treasury bills rose from 15 percent at end-2001 to 31 percent at end-2003 before declining to 10–15 percent from mid-2005. Inflation fell to less than 1 percent at end-2006 before a spike in the prices of some imported food items pushed it to around 6 percent during most of 2007. Real GDP expanded at a robust average annual rate of 6.5 percent, led by the tourism, telecommunication, and construction sectors. Tourism infrastructure has been a major beneficiary of foreign direct investment (FDI).

Gambia’s longer term policy objectives are sketched in the ambitious Vision 2020 document which aims to turn Gambia into a diversified middle income economy with the private sector as "a serious partner in national development and the very engine of growth."

Selected Indicators:

Agriculture:
Products: groundnuts (140,000 tonnes - 2005), rice, millet, sorghum, corn, sesame, cassava, palm kernels; livestock: cattle, sheep, goats

Budget:
revenues: $181.1 million
expenditures: $163.4 million (2007 est.)

Current Account Balance:
-$70 million (2007 est.)

Export Commodities:
Groundnut products, fish, raw cotton, palm kernels, hides & entrepot trade

Export Partners (Principle):
India 37.7%, China 17.5%, UK 8.7%, France 5.1%, Belgium 4.2% (2007)

Exports:
$111 million f.o.b. (2008 est.)

External Debt:
$628.8 million (2003 est.)

Foreign Exchange Reserves:
$142.8 million (31 December 2007 est.)

Gross Domestic Product (Estimates - 2008):
GDP (Official Exchange Rate)
$653 million

GDP (PPP)
$2.044 billion

GDP Real Growth Rate
4.5%

GDP Per Capita (PPP)
Purchasing Power Parity
$1,200

GDP Composition by Sector
agriculture: 33%
industry: 8.7%
services: 58.3%
 
Industries:
Processing peanuts, fish, and hides; tourism; beverages; agricultural machinery assembly, woodworking, metalworking & clothing

Imports:
Commodities: foodstuffs incl. rice, flour, sugar, manufactured goods, petroleum, heavy fuel oil, cement bulk & bags, auto vehicles, machinery equipment .

Import Partners:
China 23.7%, Senegal 11.5%, Cote d'Ivoire 8.3%, Brazil 8%, Netherlands 5.2% (2007)

Imports:
$301 million f.o.b. (2008 est.)

Inflation - Annual:
(consumer price index)
7.0 % per cent 2008

Labour Force:
400,000

Labour Force by Occupation:
agriculture 75%, industry, commerce, and services 19%, government 6%

Unemployment Rate:
The Gambia's unemployment rate is very high though no exact figures are available.

Top of Page

Central Bank of The Gambia: (CBG)

MPC Press Release (4 February, 2013).


(Average inflation in Gambia is 4.5 percent - 12-month moving average)

"Since the previous meeting of the Monetary Policy Committee (MPC), global economic prospects have improved modestly. Although global economic growth is estimated to have decelerated to 3.2 percent in 2012 from 3.9 percent in 2011, output is projected to strengthen gradually through 2013, averaging 3.5 percent. A further strengthening to 4.1 percent is expected in 2014. There are, however, downside risks to the outlook including slow recovery in the Euro Area and excessive near-term fiscal consolidation in the United States.

For advanced economies, economic growth is projected at 1.4 percent in 2013 from the 1.6 percent projected earlier. Economic activity in emerging and developing economies remains robust thanks to supportive policies. Growth is expected to reach 5.5 percent in 2013 from 5.1 percent in 2012.

According to the Gambia Bureau of Statistics, real gross domestic product (GDP) of The Gambian economy is estimated to have grown by 4.0 percent in 2012 following a contraction of 4.3 percent in 2011. Preliminary projections indicate that output would expand by 10.0 percent in 2013 premised on strong growth of agriculture and tourism.

The pace of monetary expansion moderated in line with expectations. Money supply grew by 7.8 percent in 2012 compared to 11.0 percent in 2011 and the target of 8.5 percent. Reserve money, the Bank’s operating target, rose by 6.8 percent compared to 15.6 percent in 2011. Reserve money was projected to grow by 5.8 percent in 2012.

In order to ensure effective transmission of monetary policy, it is essential to continue strengthening the resilience of banks. Bank soundness is also critical to protect depositors and other creditors as well as ensuring an appropriate provision of credit to the economy.

The banking industry remains fundamentally sound. The industry’s capital and reserves increased to D3.06 billion in December 2012 compared to D2.63 billion in 2011 mainly on account of capital injection totaling D392.4 million. The average risk-weighted capital adequacy ratio also increased to 33.0 percent compared to 25.1 percent in 2011 and the minimum requirement of 10 percent. The gearing ratio was only 3.03 times, lower than the 4.0 times in 2011 and the prudential ceiling of 10 times.

Total industry assets increased to D20.6 billion, or 10.5 percent from 2011. Loans and advances, accounting for 26.4 percent of total assets, decreased to D5.3 billion, or 2.4 percent from a year ago. Credit to distributive trade, building and construction and other commercial loans increased by 5.0 percent, 11.0 percent and 26.0 percent respectively. In contrast, advances to agriculture, transportation and tourism declined by 3.0 percent, 6.0 percent and 5.0 percent respectively. The non-performing loan ratio decreased to 11.6 percent of gross loans, lower than the 12.6 percent in 2011.

Deposit liabilities rose to D13.08 billion, or 2.1 percent over 2011. The loan to deposit ratio decreased to 41.6 percent against 44.1 percent in 2011. The liquidity ratio was 78 percent in 2012, or an increase of 4.0 percent from 2011.

The industry’s net profit rose from only D12.2 million in 2011 to D102.2 million in 2012. The return on assets and return on equity increased to 1.98 percent and 3.33 percent compare to 0.26 percent and 0.46 percent respectively in 2011.

The outstanding domestic debt increased to D10.7 billion (37 percent of GDP) in 2012, or 14.3 percent from a year ago. Treasury bills and Sukuk Al-Salam combined and accounting for 80.0 percent of the domestic debt rose to D8.6 billion, or 21.0 percent.

The yield on all the maturity profiles increased in 2012 with the exception of the 364-day bills. The yield on the 91-day and 182-day bills increased to 9.53 percent and 10.21 percent from 8.07 percent and 10.18 percent in 2011. Similarly, the yield on the SAS bills rose to 9.77 percent from 9.07 percent during the same period. In contrast, the yield on the 364-day bills declined to 10.9 percent from 11.85 percent in December 2011.

Provisional balance of payments estimates for the first nine months of 2012 indicate an overall deficit of US$9.19 million compared to a surplus of US$64.14 million in the corresponding period a year ago. The current account balance, including current transfers, was in a surplus of US$19.16 million, lower than the surplus of US$64.47 million a year ago. The deficit in the capital and financial account widened to US$28.35 million from US$0.34 million in the corresponding period in 2011.

Gross international reserves stood at US$184.5 million as at end-December 2012, equivalent to about 5.0 months of imports of goods and services.

Volume of transactions in the domestic foreign exchange market, measured by aggregate purchases and sales, increased to US$1.6 billion in 2012 from US$1.4 billion in 2011.

The Dalasi weakened against all major international currencies traded in the foreign exchange market. Year-on-year to end-December 2012, the Dalasi depreciated against the US dollar by 11.6 percent, Pound Sterling (18.0 percent) and Euro (11.5 percent).

Preliminary estimates of government fiscal operations in 2012 showed a lower deficit (including grants) of 4.4 percent of GDP compared to 4.6 percent of GDP in 2011. Total revenue and grants increased to D6.5 billion (22.5 percent of GDP) or 15.7 percent from 2011. Government expenditure and net lending also rose to D7.7 billion (26.9 percent of GDP), or 13.6 percent from 2011.

End-period inflation, measured by the National Consumer Price Index (NCPI), increased slightly to 4.9 percent in December 2012 from 4.4 percent in December 2011. Average inflation (12-month moving average) was 4.5 percent compared to 5.4 percent a year earlier.

Consumer food inflation fell slightly to 5.6 percent in December 2012 from 5.7 percent in December 2011. Non-food inflation, on the other hand, increased to 4.0 percent from 2.4 percent in December 2011.

Core inflation, which excludes the prices of energy, utility and volatile food items, increased slightly to 4.9 percent from 4.3 percent in December 2011.

Inflation Outlook
Inflation is forecast to remain in single digit consistent with the pace of monetary expansion. The MPC, however, assesses the balance of risks to the inflation outlook to be on the upside given heightened inflationary expectations.

Decision
In the light of these developments, the MPC is of the view that the current monetary policy stance is appropriate and has therefore decided to leave the Rediscount Rate, the Bank’s policy rate, unchanged at 12.0 percent. The MPC would continue to monitor price developments and to take action consistent with its mandate to keep inflation low and non-volatile."

Source:  MPC of CBG
See their report.

Top of Page


Top of Page
  
Home  |  Disclaimer & Legal Notices ContactPrivacy Policy
Copyright © 2009  Access Gambia  All Rights Reserved.